Blindfoldedmonkey

Monday, 13 October 2014

ARE YOU OUT OF THE BOX THINKER?

That is pretty important being that kind of person in trading and don’t be a part of the mass and ignore the herd movements. The contrarian attitude and the essence of out of box thinkig is the basement of a profitable trader. So here is a question, it seems hard but not really. Just you have to use your out of the box thinking. If you can answer properly you are smarter than most of us, if you couldn’t please scroll down and you will find the answer below.


-
-
-
-
-
-
-
-
-
-
-
-
-

- 87, you have to see the picture upside down. The sequence is 86, 87, 88, 89, 90, 91.

The BFM Assets Team.


Thursday, 9 October 2014

WELCOME VOLATILITY!

The old one says in Wall Street “Market goes up as escalator and goes down as elevator.” Yesterday has happened the reverse of that, the US market rallied massively. SP500 made its biggest one-day gain in 12 months. DJIA hit its biggest one day jump in 2014.


US indices scored their biggest one-day gains this year. The volatility was brutal. Huge gains and losses followed by day by day. Yesterday was the fifth session over the past 10 trading days when the S&P 500 moved by 1% or more. That is a nerve killer.

  • S&P 500 +1.75%
  • DJIA +1.64%
  • Nasdaq +1.90%

How long does it take this rally? Just take a look at the SP500 chart below. The market was pretty oversold and within few hours it could recover rapidly. The sentiment changed within couple of hours from bearish to bullish on the floor. As we anticipated few times in the last days the market close above the 1.960 key resistance level so the area is opened on the long side further gains.


The BFM Assets Team.


Wednesday, 8 October 2014

10% CORRECTION IN SP500?

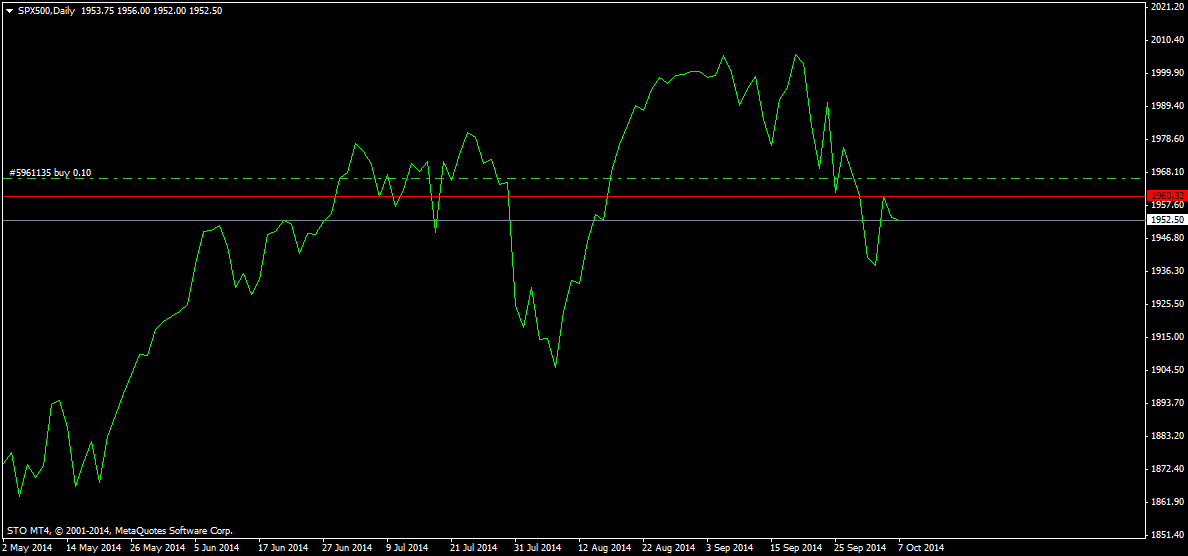
Might be, we never know. So far, we have seen closely 5% tumble since 20th September. Currently, nobody can be sure about the market rebounces or falling further down, but don’t be surprised if the correction keeps going on further.

We haven’t had a correction in such a long, long time since 2011 we haven’t seen a double digit correction for more than 36 months and normally it needs to come each year. The last big decline with 19.4% ended on October 3rd, 2011. So if the correction comes don’t be scared that is part of this business. Honestly I think the correction is good for the market because:

  • You can find good bargain stocks and you could be able to buy the market at lower levels
  • Many good buying opportunity occur
  • That is healthy for the longer term bullish run and refreshing the bulls
  • Gives new investors an entry point into the market
  • Reducing a bit the P/E ratio


To take profit from advantages of the double digit correction you have to keep you cash dry. You have to have free capital to buy the dips right after the correction, so never use all your capital in the trading, your free and uninvested capital is also an asset of your portfolio.

Technically on the SP500 chart the resistance level is still at 1.960, until that level we should wait and watch.


The BFM Assets Team.


Tuesday, 7 October 2014

CONSOLIDATION DAY

Monday in early hours all major indices rose sharply after the opening bell, but couldn’t sustain their gains and turned into red. Yesterday was a consolidation day and the 3rd positive day hasn’t come.

  • Dow -0.1%
  • S&P 500 -0.2%
  • Nasdaq - 0.5%
  • Russell 2000 - 0.9%


The sell-off wasn’t driven by any particular news and the volume was really moderate. All in all that was a real quiet day. The DJIA and SP500 remain on track for gains this year DJIA +2.5% and SP500 +6.3%.

Technically the SP500 is still in its downtrend. To break this correction the price needs to close first above the 1.960 key resistance level. Over this level starts only the bullish territory.


The BFM Assets Team.


Monday, 6 October 2014

TESLA

Let’s imagine that you were a smart and lucky enough and bought the Tesla IPO in 2010 at price around 17$, its price now is 255$. So if you still hold your position your profit is more than 1300%.

It sounds great, but I doubt that anybody was brave enough and hold the portfolio during the last 4 years. Why? The one word answer is the volatility. The volatility is one of our biggest enemy in trading because it creates anxiety and pushing us to sell earlier the stock. If you look at below the chart you can see the Tesla’s price rallied and collapsed too many times. In the first six months gained 400% and then lost 40% within 10 weeks. In 2013 dropped from 200$ to 125$ - roughly 40% within two months.


Our hand and brain get nervous when we see as investor such great corrections. I am just asking you how you would behave at 40% correction. Are you sure about still holding the Tesla?

Tesla has made a great performance, but due to the volatility is almost impossible to hold for years. Check below the matrix and comparing the volatility to SP500. Closely 50 times happened a -5% or bigger daily drop. I am sure you would sleep well at those days.


All in all, the Tesla seems a great investment, but for me is more stressful than is reasonable and doesn’t worth for me the risk.

The BFM Assets Team.


Friday, 3 October 2014

MORE BEARS AND LESS BULLS – AAII SENTIMENT SURVEY


AAII Bulls & Bears Sentiment Index (Blue/Bull, Red/Bear)

In the last two weeks nearly 5% correction on SP500 has been enough for retail investors to turn into more bearish mood. They are less bullish than last week according to the AAII sentiment survey.


They are broadly in risk off mood and they are more pessimistic. The optimism has been evaporated by now. This sentiment is commonly used as a short term contrarian indicator. Yes, maybe sometimes is good, but don’t overestimate the relevance of this data flow. Statistically proven that is not a perfect indication of the market, but sometimes is really helpful.


In September among the individual investors the bullish attitude was the highest since last December and you see what happened – 5% correction. By now the bullish sentiment consolidated by 6,4% which is a good sign that shortly could come a buying back opportunity. The percentage of bullish investors, those who think markets will rise in the next 6 months, fell to 35.4% from 41.8% the week before. The percentage of bearish investors rose to 30.9%, above its historical average. As the old rule says on Wall Street “Buy the pessimism and sell the euphoria.”

The BFM Assets Team.

Wednesday, 1 October 2014

SEPTEMBER SUMMARY

U.S. indices finished yesterday’s choppy trading session slightly lower. Tuesday the benchmarks ended the month and Q3. The last day was really up and down trading session and appeared to find the direction the market. The S&P 500 gained 0.6% for the quarter and finalized its seventh consecutive quarterly gain; this is the longest period of gains since 1998. The DJIA is up 1.3% in the third quarter. The Nasdaq also posted its seventh quarterly gain in row, the longest one since 1996.


Yesterday data:

  • SP500 -0.28%
  • DJIA -0.17%
  • Nasdaq -0.28%

Technically the whole September has been very choppy and moved the market in a range. Down and up and down was the pattern for September in DJIA. The key resistance level is at 17,120, so until is not taken we have to wait for the bullish trend.


The BFM Assets Team.