Blindfoldedmonkey: October 2014

Friday 31 October 2014

V-SHAPE RECOVERY AND INVESTORS MENTALITY

We have experienced a nice V-shape recovery in the last two weeks in US markets. The S&P500 dropped from 2.020 level down to 1.820 within a month and then recovered pretty fast within two weeks. The average and typical retail investors were panicing and selling close the lowest points most of them expected more sell-off and finally they capitulated. They were just watching all along the way up and now they got started being more optimistic. They sell at low and buy now at highs. They are not reading well the V-shape pattern.


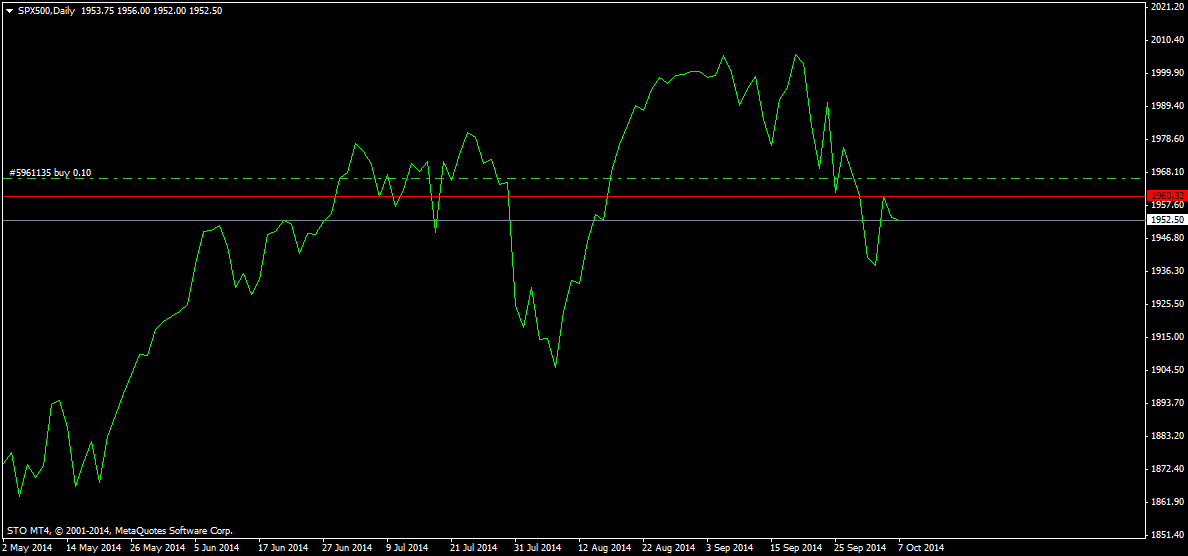
The sentiment of a typical investor is turned around in the last two weeks from super pessimism optimism. They had a panic sell at the dip in the middle of October. After their sell, close to the lowest points of the market they started only to buy in the last day and missed many profitable days. They all forgot again the number one rule of all markets „Buy low sell high”. They have done again the opposite as far as I read and see in the forums and different trading blogs. This chart below shows perfectly well how an average investor works.

You have to work contrarian like that mental approach if you want to be profitable. Don’t panic at sell-offs, try to ignore the pain of your loss. If you fell the pain you are overpositioned, so reduce your exposure. Those are inevitable rules being more successful in the trading arena.


The BFM Assets Team.


Thursday 30 October 2014

REST IN PEACE – QUANTITATIVE EASING

Here is the end of Fed’s unconventional monetary policy, its monthly bond-buying program. The reactions say after the FED decision that FED turned into a hawkish mood. I guess that is only an oxymoron. From our side we are more bullish.


The point is that after yesterday decision of the end of QE (Not Queen Elisabeth) the market dropped a bit, but not much and recovered, so all in all Mr. Market doesn’t care about QE anymore, it was already priced in. This announcement did nothing. The DJIA snapped a four-day winning streak on Thursday, but was not in free fall, only slipped lower. Remember how the people freaked out a year ago and forecasted the end of the world if the FED stops QE. They were all wrong. The world is not ended when the QE ended. The economists are usually wrong about the FED next move. They still say the end of QE means downturn. I doubt that totally.

After Q1 and Q2 tapering the market did some corrections, but in longer term they recovered and got much higher again and again. Our forecast is the same for the recent situation, might come some consolidation, but the bullish trend is still unviolated. So Hakuna Matata, don’t worry, the market survives everything and all of us. The good news is the interest rate is likely to stay at near zero until June 2015.


The BFM Assets Team.


Wednesday 29 October 2014

BEARS AND SIDELINERS... WHAT DO YOU SAY NOW?

US benchmarks have seen a severe drop and then a big rebound in September and October. The S&P 500 fell roughly 10% from its mid-September peak to its mid-October low, but then the benchmark jumped 4.1% last week for its biggest weekly gain since January 2013. All US indices turned in a nice V-shaped recovery. The Dow closed again above 17,000 key resistance level on Tuesday. Yesterday continued the optimism and traders bid up prices.

  • Nasdaq +1.75%
  • SP500 +1.19%
  • DJIA +1.12%


Technically it seems inevitable to hit new high at 2.015 on SP500 again shortly, within a week.


The BFM Assets Team.


Tuesday 28 October 2014

FOREX TRADING – THE LOSER’S ARENA?

The old 6 month rule of forex market says “90% of traders lose their capital within 6 months.” My personal statistics is worse, I have never met any profitable forex trader when I was working for a broker house with around 12.000 clients.


Honestly, we don’t trade forex, for some simple reasons:

  1. We don’t know anybody who has been consistently profitable in forex trading. We do think if you are not an investment banker don’t trade forex. 
  2. We are concerned about forex, because there is no major trends really occurs like in the commodity or equity markets. So you have to be on the both side, therefore trading forex is double riskier. 
  3. The high leverage 1:100, 1:200, 1:500 is slaughtering the forex traders. 

Recently we found a great statistics from France which shares our concerns about forex investments. The French Finanacial Authority - Autorit̩ des March̩s Financiers Рis issued a very sobering report about the French forex industry.

  • 9 out of 10 clients lost money – 89% of clients are losers
  • The average loss per client was nearly €10,900 (2009-2012)
  • During this period 13,224 clients lost nearly €175 million, while the remaining 1,575 clients earned a total of €13.8 million

An other report from UK based forex company Plus 500 states that they are losing month by month huge numbers of clients. They drop out due to their huge losses. They have 67.000 clients, but they need to add each month new 10.000 customers to keep the level of 67.000. All in all don’t believe to the massive marketing hypes that forex trading is easy, that is a lie and try to ignore the forex arena.

The BFM Assets Team.


Monday 27 October 2014

LAST WEEK WAS OUTSTANDING!

SP500 posted its biggest weekly gain of 2014. Three days gap up in the last 7 days. Against all the worries of Ebola the sentiment was positive and all benchmarks closed green and delivered nice weekly returns. SP500 rose 4.1% for the week, stopped the four-week losing streak and finished its biggest weekly percent gain since January 2013. DJIA gained 2.6% for the week. Nasdaq, the tech index climbed 5.3% for the week, its largest weekly percentage gain since December 2011.


There was lots of pessimism in the last 6 weeks which turn into optimism last week. The market due this uncertainty is still so volatile. Indices have been volatile this month, with Thursday’s session marking the 10th in October that the Dow ended with a move of more than 1%. That is the most since November 2011. The market was in the real roller-coaster nerve killing mood, which mostly hated by investors. This pattern usually creates by Mr. Market the most dreamless nights for an average investor.

If you didn’t buy the dip as we recommended last Monday you are out. The train has left the station without you that is pity, but not too late yet. The SP500 hit our forecasted level at 1.970. The index is a bit pricey now, but not super pricey yet and still there is room for more gains.


The BFM Assets Team.


Friday 24 October 2014

NOT ENOUGH ANXIETY

The individual investors are not panicking after the bigger than 8% drop of SP500 according to AAII weekly sentiment report. (The AAII Investor Sentiment Survey measures the percentage of individual investors who are bullish, bearish, and neutral on the stock market for the next six months; individuals are polled from the ranks of the AAII membership on a weekly basis. Only one vote per member is accepted in each weekly voting period.)


Long-Term Average:

  • Bullish: 39.0% 
  • Neutral: 30.5% 
  • Bearish: 30.5% 

We are pretty much over the long term average median. The bullish sentiment increased by 7% this week and the bearish sentiment dropped by 11.2%. Surpsringly this positive sentiment improvement has happened after stocks were hit by heavy selling. After such a closely 10% correction since September usually the individual investors getting more scared, but not now, which might be a red flag for more rally.


The markets performed well yesterday and all US benchmark indices closed in green territory again.

  • DJIA +1.32%
  • SP500 +1.23%
  • Nasdaq +1.60%

Thursday was the 10th session this month that the DJIA jumped or dropped by more than 1%.

The BFM Assets Team.


Thursday 23 October 2014

MARKET GOES UP WHEN THERE ARE MORE BUYERS THAN SELLERS

That simple is that. Recently that is the biggest lifting power. The DJIA performed well last days, S&P 500 and Nasdaq hit their biggest one-day point jumps since late 2011. DJIA is up 0.2% for the year, after tumbling into negative territory in the earlier stages of the pullback on Oct. 10. The index has fallen from almost a month and by now partly recovered, since the buyers came back to the floor.


Most of us just say, the market was oversold, that is true, but honestly the market could be oversold for 2-3 months without any great rebounce. This 4 days winning streak rally means the sellers left the floor. That is funny the biggest rallying days always come in corrections and in dips not on the tops. We are expecting more gains after the follow through day, Tuesday. Our first target is 1.970 on SP500.


The BFM Assets Team.


Wednesday 22 October 2014

FOLLOW THROUGH DAY

All nasty market correction eventually ends and after comes the rebounce. This pattern is widely known as a chart sign that identifies market bottoms. Every major bull market rally begins with “Follow-Through Day" and is a tool used by traders to identify market bottoms. The pattern starts as the market falls by some percentage; the SP500 dropped more than 9% in the last couple of weeks. On a Day 1 the market closes higher, Day 2 and Day 3 cannot be lower than the Day 1 and comes the Day 4, which is the “Follow-Through Day". On Day 4, 1% or more gain is an appropriate. Yesterday Sp500 gained 1.94%.


On Tuesday the Nasdaq registered its fourth consecutive gaining day and its best one-day advance in more than 20 months. The SP500 benchmark index rose for the fourth straight day and best one-day gain this year. On the other side, the last 3 days have seen VIX drop 12.74%, 15.55%, and 13.4%. This fear index has never dropped more than 10% for 3 days is a row.

All in all yesterday was a real “Follow-Through Day", no doubt. Follow-throughs typically emerge on the fourth, fifth, sixth or seventh day of a new rally. So we are expecting more gains this week further till Friday. In our forecast we see the SP500 at 1.970 pretty shortly again.


The BFM Assets Team.


Tuesday 21 October 2014

BLACK MONDAY

If you missed it, Sunday was the anniversary of 1987 crash – in 2014 terms, that would be a one day drop of 3700 Dow point! Ouuch!


In the history of Wall Street Black Monday refers to Monday, October 19, 1987, when the stock markets suffered their biggest daily drop in the history. The crash began in Far East, moved to Europe and hitting the Wall Street. The DJIA dropped by 508 points to 1738, minus 22% within a day.

Early on in 1987 stock markets gained much, the DJIA was on 44% profit in seven months. Finally after the severe drop in October the DJIA was positive for the 1987 calendar year. It opened on January 2, 1987 at 1,897 points and closed on December 31, 1987 at 1,939 points.


A popular explanation for the crash was shorting by technical and computer traders. However, economist Dean Furbush pointed out that the biggest price drops occurred when trading volume was light. After this huge drop the regulation changed and developed new rules, known as circuit breakers, allowing exchanges to halt trading temporarily in instances of exceptionally large price declines. Under the rules, the NYSE - New York Stock Exchange would temporarily halt trading when the S&P 500 stock index declines 7%, 13%, and 20% in order to allow investors to make informed choices when the market is highly volatile.

The vast majority of people thought that it was the end of the world, but within 2 month the market recovered and rallied until the .com bubble – 2000.

The BFM Assets Team.


Friday 17 October 2014

“BE FEARFUL WHEN OTHERS ARE GREEDY AND GREEDY WHEN OTHERS ARE FEARFUL” W. BUFFETT

Why is bad if the market falls? Hey, hang on a second. The market is in correction and many folks lose money. Which we think is a bad news. Bad news, really? But wait... if the only way I can make money in the stock market is to buy low, why is a falling market bad news? You can look at the falling market not a problem, but a great opportunity – that is the via negative approach. Try to look at the US market recent dips like a good buying chance.


Do you really think Warren Buffet shows any sign of worries now about the market, I doubt that. I presume this dip when S&P 500 is down 7.4% from its record closing high is really nothing for him. He experienced much bigger disasters early on. Obviously he's buying stocks now, why not? In his interpretation the best time to buy any asset is when is cheaper, not when it’s more expensive. He said on CNBC. “I like buying it as it goes down, and the more it goes down, the more I like to buy,” On contrary the retail investors, pundits and forecasters have anxiety I can bet on that.

The bottom line is that the market has been so high for so long, that a pullback is most likely good for the market, and just think, now is a buying opportunity! Eventually, no one can predict the market, but a lot try, some win, some lose just like at the racetrack. When it does finally come the recovery, get in and put your money into the market.

I wouldn’t say buy immediately just wait for the confirmation, for instance technically if the DJIA closes above the 16.400 resistance key level. But can the market fall even more? Sure it can.


The BFM Assets Team.


Thursday 16 October 2014

BLOOD ON THE STREET

The Massacre of the Bulls got started and yesterday fastened further and seems today keeps going on. What’s going on now? Correction folks, no doubt. Panic, fear and anxiety rule the market nowadays, it seems to me only seller left on the floor. Don’t try catch up the falling knife, the early buyers always burn out. The rebounce will only come when the early chickens are already burned out.


Some core details of general massacre:

  • VIX 3 years high, jumped Wednesday 16%
  • SP500 and DOW turned negative in year they erased all YTD gains
  • Dow's worst percent decline since Nov. 9, 201
  • The Dow has lost more than 1,000 points this October.
  • Yesterday was the 1,233rd worst day in the history of the S&P

Some historical statistics of October:

  • On a daily percent basis, the top three, and eight of the 15 largest down days occurred in October.
  • The DJIA’s best October in the past 20 years was in 2002, when it gained. 10.6%. 
  • Its worst was no surprise, in 2008, when it lost 14.1%.
  • Over the last 20 years the Dow has averaged a gain in October of 1.7%. 
  • At the moment, the Dow is off 6.7% for October.

The knife is still in falling mood so don’t try to catch only try first when will be above the 16.300 resistance level.


The BFM Assets Team.

Wednesday 15 October 2014

PROFESSIONALS ARE MORE PESSIMISTIC

Professional fund managers are getting more scared and more bearish according to the BoA - Merrill’s poll in October. The survey asked 220 money managers responsible for $640 billion of assets. The report shows their equity allocation dropped from 47% to 34% in their portfolio. That is the lowest level since 2012 and they are getting more pessimistic about the macroeconomic fundamentals globally. Only 30% of them think the world economy is in good shape.


They are getting scared about the volatility and uncertainty around the world. So, they raised their allocation to bonds to a seven-month high, 60%. All in all fund managers still prefer equities to bonds, but they are rapidly rebalancing. They also raised their cash holdings to 4.9%percent from 4.6%.

Fund managers also cut their emerging market equity exposures. They cut their euro zone equity exposure to a 15-month low, a net overweight position of just 4% as the economic outlook blackened remarkably.

Does the reshuffle of their portfolios mean anything? Yes, when the pros get back slightly to safe assets means lower buying power in the short-term in stock markets.

The BFM Assets Team.


Tuesday 14 October 2014

S&P 500 BROKE THE 200 DAYS MA LINE

The 200 Days Moving Average means anything? I don’t really know, I suppose it is only a moment for the market, but for many technicians is relevant and is considered significant as many analysts see the breach as a sign of further declines. The SP500 closed first time below the 200MA since November 2012. I guess it is only a technical superstition nothing more. Statistically is not proving anything neither bear nor bull market.


The sell-off is still continuing, Monday was also a pretty red day. The big volatility also predicts some big movement needs to come shortly.

Technically below 1.960 nothing will happen, only if this key resistance level would be taken it should mean bullish trend again for the SP500.


The BFM Assets Team.


Monday 13 October 2014

ARE YOU OUT OF THE BOX THINKER?

That is pretty important being that kind of person in trading and don’t be a part of the mass and ignore the herd movements. The contrarian attitude and the essence of out of box thinkig is the basement of a profitable trader. So here is a question, it seems hard but not really. Just you have to use your out of the box thinking. If you can answer properly you are smarter than most of us, if you couldn’t please scroll down and you will find the answer below.


-
-
-
-
-
-
-
-
-
-
-
-
-

- 87, you have to see the picture upside down. The sequence is 86, 87, 88, 89, 90, 91.

The BFM Assets Team.


Thursday 9 October 2014

WELCOME VOLATILITY!

The old one says in Wall Street “Market goes up as escalator and goes down as elevator.” Yesterday has happened the reverse of that, the US market rallied massively. SP500 made its biggest one-day gain in 12 months. DJIA hit its biggest one day jump in 2014.


US indices scored their biggest one-day gains this year. The volatility was brutal. Huge gains and losses followed by day by day. Yesterday was the fifth session over the past 10 trading days when the S&P 500 moved by 1% or more. That is a nerve killer.

  • S&P 500 +1.75%
  • DJIA +1.64%
  • Nasdaq +1.90%

How long does it take this rally? Just take a look at the SP500 chart below. The market was pretty oversold and within few hours it could recover rapidly. The sentiment changed within couple of hours from bearish to bullish on the floor. As we anticipated few times in the last days the market close above the 1.960 key resistance level so the area is opened on the long side further gains.


The BFM Assets Team.


Wednesday 8 October 2014

10% CORRECTION IN SP500?

Might be, we never know. So far, we have seen closely 5% tumble since 20th September. Currently, nobody can be sure about the market rebounces or falling further down, but don’t be surprised if the correction keeps going on further.

We haven’t had a correction in such a long, long time since 2011 we haven’t seen a double digit correction for more than 36 months and normally it needs to come each year. The last big decline with 19.4% ended on October 3rd, 2011. So if the correction comes don’t be scared that is part of this business. Honestly I think the correction is good for the market because:

  • You can find good bargain stocks and you could be able to buy the market at lower levels
  • Many good buying opportunity occur
  • That is healthy for the longer term bullish run and refreshing the bulls
  • Gives new investors an entry point into the market
  • Reducing a bit the P/E ratio


To take profit from advantages of the double digit correction you have to keep you cash dry. You have to have free capital to buy the dips right after the correction, so never use all your capital in the trading, your free and uninvested capital is also an asset of your portfolio.

Technically on the SP500 chart the resistance level is still at 1.960, until that level we should wait and watch.


The BFM Assets Team.


Tuesday 7 October 2014

CONSOLIDATION DAY

Monday in early hours all major indices rose sharply after the opening bell, but couldn’t sustain their gains and turned into red. Yesterday was a consolidation day and the 3rd positive day hasn’t come.

  • Dow -0.1%
  • S&P 500 -0.2%
  • Nasdaq - 0.5%
  • Russell 2000 - 0.9%


The sell-off wasn’t driven by any particular news and the volume was really moderate. All in all that was a real quiet day. The DJIA and SP500 remain on track for gains this year DJIA +2.5% and SP500 +6.3%.

Technically the SP500 is still in its downtrend. To break this correction the price needs to close first above the 1.960 key resistance level. Over this level starts only the bullish territory.


The BFM Assets Team.


Monday 6 October 2014

TESLA

Let’s imagine that you were a smart and lucky enough and bought the Tesla IPO in 2010 at price around 17$, its price now is 255$. So if you still hold your position your profit is more than 1300%.

It sounds great, but I doubt that anybody was brave enough and hold the portfolio during the last 4 years. Why? The one word answer is the volatility. The volatility is one of our biggest enemy in trading because it creates anxiety and pushing us to sell earlier the stock. If you look at below the chart you can see the Tesla’s price rallied and collapsed too many times. In the first six months gained 400% and then lost 40% within 10 weeks. In 2013 dropped from 200$ to 125$ - roughly 40% within two months.


Our hand and brain get nervous when we see as investor such great corrections. I am just asking you how you would behave at 40% correction. Are you sure about still holding the Tesla?

Tesla has made a great performance, but due to the volatility is almost impossible to hold for years. Check below the matrix and comparing the volatility to SP500. Closely 50 times happened a -5% or bigger daily drop. I am sure you would sleep well at those days.


All in all, the Tesla seems a great investment, but for me is more stressful than is reasonable and doesn’t worth for me the risk.

The BFM Assets Team.


Friday 3 October 2014

MORE BEARS AND LESS BULLS – AAII SENTIMENT SURVEY


AAII Bulls & Bears Sentiment Index (Blue/Bull, Red/Bear)

In the last two weeks nearly 5% correction on SP500 has been enough for retail investors to turn into more bearish mood. They are less bullish than last week according to the AAII sentiment survey.


They are broadly in risk off mood and they are more pessimistic. The optimism has been evaporated by now. This sentiment is commonly used as a short term contrarian indicator. Yes, maybe sometimes is good, but don’t overestimate the relevance of this data flow. Statistically proven that is not a perfect indication of the market, but sometimes is really helpful.


In September among the individual investors the bullish attitude was the highest since last December and you see what happened – 5% correction. By now the bullish sentiment consolidated by 6,4% which is a good sign that shortly could come a buying back opportunity. The percentage of bullish investors, those who think markets will rise in the next 6 months, fell to 35.4% from 41.8% the week before. The percentage of bearish investors rose to 30.9%, above its historical average. As the old rule says on Wall Street “Buy the pessimism and sell the euphoria.”

The BFM Assets Team.

Wednesday 1 October 2014

SEPTEMBER SUMMARY

U.S. indices finished yesterday’s choppy trading session slightly lower. Tuesday the benchmarks ended the month and Q3. The last day was really up and down trading session and appeared to find the direction the market. The S&P 500 gained 0.6% for the quarter and finalized its seventh consecutive quarterly gain; this is the longest period of gains since 1998. The DJIA is up 1.3% in the third quarter. The Nasdaq also posted its seventh quarterly gain in row, the longest one since 1996.


Yesterday data:

  • SP500 -0.28%
  • DJIA -0.17%
  • Nasdaq -0.28%

Technically the whole September has been very choppy and moved the market in a range. Down and up and down was the pattern for September in DJIA. The key resistance level is at 17,120, so until is not taken we have to wait for the bullish trend.


The BFM Assets Team.