Blindfoldedmonkey: April 2014

Wednesday 30 April 2014

TUESDAY RALLY, FOLKS!

Again and again, that is a crazy shape and paradigm of the US markets in 2014. That is a statistical anomaly, but seems very astonishing so far YTD. Tuesdays perform really well this year, but on the other hand before creating any trading strategy on that such pattern, it means nothing for the future just a small curiosity. But the Marketwatch and Business Insider created this fascinating chart.


Stocks on the Wall Street closed moderately higher yesterday again. The tech and financial sectors were leading the gain and biotech recovered well either. The US markets are pretty close again to their previous tops, it is more effective in terms of European markets, they are at upside of their range. The appetite for risk is increasing again and investors turned into RISK ON mood after the last month RISK OFF behaviour.


Technically the DJIA is pretty close to hit the previous top at 16.600. Only 100 points distance is nothing. The bulls are chasing around the block. We can find a reversal Head&Shulder pattern on the daily chart that is a good signal. If the neckline would be taken at 16.600 could come a great and eruptive rally. On the negative side if any day the index close below 16.400 is a clear signal for bears. This week we are going to have the final answer, which way wants to go the market. In my interpretation I see more possibility for the bullish rally.


The BFM Assets Team.

Tuesday 29 April 2014

TREND FOLLOWER GURU: NICOLAS DARVAS

We know plenty of trend followers - in my humble opinion they are the only long term winners of the market. Like Richard Dennis, Paul Tudor Jones, Richard Donchian, George Soros, Jesse Livermore… but there is one remarkable self-taught guy, Nicolas Darvas. He invented the very useful andvery simple trend following technical system, the Darvas Box Theory.


He graduated as an economist in Hungary, but later became a famous dancer around the world at the time of Second World War. He travelled and danced around through the planet and became a famous and successful show dancer. Once in Canada after his show the club owner didn't have enough cash and as a compensation, Darvas received 3000 pieces of Brilund stocks, a Canadian mine company's paper. He didn’t check the price of the stock for two month, but after when he realized that tripled its worth he decided to start investing into stock business.

All of us had already this experiment. At the first trade we made nice profit and we started to believe we are the best traders on the world. He did as well. He started to subscribe to broker’s letters, he read all books about the markets. But you know what happened? He lost everything.

After two years of losing he decided to choose his own way and he invented the Darvas Box Theory. He considered the stocks are moving in waves in bull markets. After huge rallies the stocks are consolidating for a while and break out only, if the sentiment is still strong bullish enough. When the stock was in a box, he was flat and waited for proper time. He bought when the price broke out of the box. He was a perfect trendfollower, didn't want to create the trend only wanted to follow it. He simultaneously set a stop-loss order just under opening price. All in all he traded only the breakouts, and used daily chart timeframe. Here is below a chart template for his box theory.


With his new approach – the box system, he came up and made 2,45 million dollar fortune – now it is worth more than 20 million dollar– within 18 month in 1957-58. Basically Darvas never sold short, but realized that his system might be easily be adapted to short markets too.

If you want to read more about Darvas Box Theory you have to check his book, "How I Made 2,000,000 in the Stock Market," published in 1960.

The BFM Assets Team.

Monday 28 April 2014

WHY ARE INVESTORS DOING STUPID THINGS?

Most of the investors, more than 90% are losing their money in the markets. That is the fact. They love their stocks when they make money, but they could hate the same stock couple of days later when it makes loss.

In the investment business when we buy any stock or asset we have to handle those 3 following questions:

  1. When to buy?
  2. Which asset to buy?
  3. How big position to buy?


Start with the first question. When to buy? Most of the investors always buy the trendy stocks and assets. Like as the Gallup poll shows recently the investors concerns about stocks is shrinking. Now picked by 24% same as for gold. This number is needed to be answered why the folks are still scared to invest into the stock market? The reason is that they still remember well for the „lost decade” between 1999-2013 when the market hasn’t make any performance.

Now the DJIA is at 16.500 and they don’t want to own stock because they do believe that the market is pricey. I am pretty sure if the DJIA jumps up within 1-2 years to 20.000-25.000 area, these same investors wouldn’t think is pricey they want to own it at that time. They will think is cheap. The point is that most of us are horrible market timer buy the high and not the bargains in most cases.


The second question is the asset. Which asset to buy?

Most of the investors still believe in gold as the chart shows above, but that doesn’t make any sense. In the last 25 years since 1988 the annualized return of gold has been only 1.6%, for S&P500 has been 7.9%. Forget the real estate and gold investment in the 20th century the big money you could make in stock markets. So, why most of small investors choose the gold to buy? Probably they think that they don’t have the skills to figure out which stock fund to choose. I wouldn’t say the stocks are not risky. But that is why we could make far more money than on any other assets.

And now we goes the 3rd point. How big position to buy? If your position size is not crazy big and you have a proper money management like never invest in one certain stock more than 5% of your capital, you can survive all the big corrections and you can be on the winning side.

DO YOU WANT TO EARN OVER 30% PER YEAR?
Invest into our fully regulated Swiss Managed Account Fund: http://www.theblindfoldedmonkey.com/managed-accounts

The BFM Assets Team.

Thursday 24 April 2014

THE CANDY STORE WAS CLOSED FOR WEDNESDAY

It seems yesterday the indices made modest corrections after the 6 days rally. That is a normal pace and part of the deal; we can’t wait the always going up market that is not existing. The DJIA and S&P500 traded in a narrow range and closed slightly in negative territory and breaking the 6-day winning streak. No problem at all. You can’t take profit everyday, the candy shop needs to be closed sometimes. The market took a rest yesterday to go up today and tomorrow further up.

  • Dow 16,502 -12 -0.07% 
  • Nasdaq 4,127 -34 -0.83%
  • S&P 500 1,875 -5 -0.24%


The S&P500 has been trading nearly to the record levels, this slight consolidation means only some short break and rest in the strong bullish momentum and we are expecting more gains in the following days up to 1.891 first and then could come the break out to 1.900. The market is strong and wants to hit the 1.900 mental level finally after closely four months huge ranging. Look at the daily chart how strong the upside power, shows much more strength than the bearish side. The recovery after the two weeks correction was rapid and impressive. There is no doubt we are in a risk off mood and the buyers are stronger than the sellers.


The BFM Assets Team.

Wednesday 23 April 2014

ANY PULLBACK, FOLKS? NO, 6th DAY RALLY IN ROW

Yes, positive winning streak is in the 6th day up in row by now. US Equity markets were on 6th gaining day on Tuesday. The leading sectors like Biotech is performing well again and made the biggest two days gain in the last 30 months. The Nasdaq Biotechnology index is up with +3.23%.


The all-time high is in sight and as we forecasted last ago it needs to hit that area within few days and will go further to new highs. The whole April is so green for all US indices. There are many warns by analysts and traders but that is a good sign, because there is still huge buying side potentials out there. Who is crying now, later will be a buyer for sure.

The typical concerns are the bubble, the volume, USDJPY carry divergence, VIX divergence, etc. Forget that complains. Just look at the SP500 chart. It tells more than thousand words. Easily the index took out the 1.872 key resistance level and now heading up to 1.890. This last six days rally is the longest one in the last six months, it is nice isn’t it. The SP500 is up 30 points YTD that is about 1.6%. Does the bearish market really look like this?


The BFM Assets Team.

Tuesday 22 April 2014

THE MARKETS AND THE SENTIMENT

US markets are in the longest rally since last October. Which shows again this is a bull market where we have to buy the dips and ignore all the bubble bursting narratives. This is far not yet a bubble. But why made the markets great rally last week, last October and February? That is the great question the rest is only a conversation.


Cause there is one common thing in those three great rallies, namely the sentiment of investors. Take a look at this chart. All 3 rallies in the last 6 month happened when the retail investors were most pessimistic and when they were mostly bearish. I use this AAII statistics as a stunning contrarian indicator. When is the Bulls/Bears sentiment is reasonable low – meaning less the 30% of investors are bullish we should buy SP500 index because there is always a good bargain at those periods and shortly after the market will do a nice bullish rally. In the last more than 2 years all the best days came right after when the retail investors were mostly disappointed and being pessimistic about any rally. And, we only have to be more cautious when they are getting optimistic on the tops. That is the simplest was to make money on the market and honestly I haven’t found so far any better explanation why the market performed well at those three periods since October 2013.


Yesterday the SP500 closed slightly higher due to Eastern holiday but as we anticipated earlier the SP500 after the last week rally hit the 1.870 level and now could come the next key resistance level at 1.890. So today all European markets after few days closure will show a really green day with nice and impressive gains. We bought last Thursday many long positions in DAX, FTSE, IBEX, CAC40 so we are going to harvest today and in the following days.

The BFM Assets Team.

Monday 21 April 2014

WHAT BRINGS THE RABBIT? MIGHT BE RALLY...

Personally I don’t believe in any seasonality because it is the explanation of lazy traders, they think there is one easy method which works always. I doubt that. The market is more complex that one rule could work forever. This Easter pattern is the same same story, sometimes works and many times doesn’t.


But as some analysts states the Easter holiday is a bullish signal for the market. That means if the market in positive territory at Easter’s days the year is going to be bullish for the rest of the year.


This historical and statistical matrix created by Schaeffer’s Investment Research. They say if “The years when the index is positive through Easter average a return of nearly 10% for the rest of the year, and have been positive an impressive 90% of the time and what about if the index is negative for the year at Easter? “Over the past 30 years when the S&P 500 is down heading into Easter, the index averages a loss of 2% for the rest of the year and is positive just half of the time.”

But remember for the great rule that the past performance is definitely no indicator of future results. But this year could work this method. Why? Because the market after many weeks of ranging and choppy stressful period finally got closer to break out levels. As Dennis Gartman says only three positions you can possible have on the bull market.

  • Very bullish 
  • Slightly bullish or 
  • Neutral 

Recently we are at first stage and extremely bullish because this is a bull market. I am always fascinated when I read the forums like I did yesterday and 99% of traders talking about more severe possible corrections and expecting those always by the following week. Wake up guys! It won’t come any big correction – we had already on Nasdaq so far 10% in the last couple of weeks and now the market wants to go up further. So don’t sell the dips, but buy them.

DO YOU WANT TO EARN OVER 30% PER YEAR? 

Invest into our fully regulated Swiss Managed Account Fund:  http://www.theblindfoldedmonkey.com/managed-accounts

The BFM Assets Team.

Thursday 17 April 2014

SP500 IN POSITIVE TERRITORY AGAIN IN YTD. IS THE RANGING OVER?

We hope so ... and really believe in that. Many factors prove us now the market after many bearish and bullish traps in the last couple of weeks finally turned into bullish mood. The market bullish trend is still intact and was not violated at all, the last weeks choppy market was only a widely ranging market pattern right before the fast and eruptive breakout. The small investors sentiment is more bearish and pretty sceptical enough to be the market bullish, they are mostly desperate and the bullish atitute is in yearly low under 30%. As we predicted in our yesterday’s blog the SP500 next resistance is at 1.873 and we are expecting the index is going to hit within 1-2 days that level.


Yesterday performances are impressive all US indices over 1% gain:

  • Dow 16,425 +162 +1.00% 
  • Nasdaq 4,086 +52 +1.29% 
  • S&P 500 1,862 +19 +1.03% 

All major worldwide indices including US, Europe and Asia are performing well and show strength on the long side with no doubt. DJIA gained three digit numbers yesterday and SP500 after the three days rally is again in positive territory for 2014 again. After the last week massacre they came back from the grave. Nasdaq made 10% within three weeks.


The BFM Assets Team.

Wednesday 16 April 2014

3 WORDS ABOUT THE MARKET: VOLATILITY, VOLATILITY, AND VOLATILITY

Choppy, choppy, and choppy sessions day after day. Sizeable drop and rebouncing, sizeable drop and rebouncing again that is the template. Just take a look at the chart of SP500 below. On Monday made great yo-yo in range of 1.814 and 1.832, first went up the market, then fall and came up again. Yesterday the same scenario in wider range 1.814 and 1.842, first up, then down and up again.

Changed the trend within those days three times intraday. That huge volatility means always the traders are freaked out and don’t know the direction of the market. During these days the market created traps over traps. Honestly this is one the hardest pattern to trade. I have only one recommendation – reduce the position size. I know it sounds trivial, but 90% of traders don’t get it and increase the size of the steak and want to get back as soon as possible the loss. Don’t do that, it ain’t work.


In our view we are expecting great bull rally in the following weeks, because the last weeks choppy market was enough to discourage the traders from the market. Our first target now at the key resistance level at 1,873.

Yesterday the Nasdaq was only 12 points intraday from 10% drop from the top. What would we should do at that level. BUY THE DIP!


The BFM Assets Team.

Tuesday 15 April 2014

REAL REBOUND OR DEAD CAT REBOUND?

The US markets have broadly gained on Monday, but one day correction means nothing. In the big picture the market is still bullish, but the performance of the market so far YTD is pretty disappointing and in the shorter term shows weakness and bearish attitude. The last week selloff was a horror show. U.S. stocks dropped last week brutally across the board. The S&P500 and Nasdaq both made their biggest weekly losses since mid-2012 and the Dow did its biggest weekly fall since mid-March.


The yesterday rally might be only a dead cat rebound. We can’t be sure this is a good buying opportunity or just a pullback. We need one or two days confirmation about the breakthrough.

The Nasdaq on YTD dropped only 2,20% but from the 7th of March top is closely 10% so we have to see some bounce back, the index yesterday made +0,58%.

  • Dow 16,173 +146 +0.91% 
  • Nasdaq 4,023 +23 +0.58% 
  • S&P 500 1,831 +15 +0.84%

The SP500’s yesterday’s rally shows some good sign, but we have to see the today performance either. Made a break out at 1,818 and now the way up to 1,846 is opened for further rally in the following days. The volatility is brutal and the over positioning is lethal nowadays for investors.


The BFM Assets Team.

Monday 14 April 2014

ART OR SCIENCE OF THE INVESTMENT?

Just quickly about the stock markets: Horror Show and Exodus. The consolidation is continued Friday further after the big Thursday selloff and all indices are in negative territory in YTD. Nasdaq is almost at 10% drop from the top.


So the today issue is the art of trading. The investment is more art than science. Ben Graham, the mentor of Warren Buffett believed in the early 20th century if we would have more data we can make better decisions on the market. But we failed. Nowadays we have myriads of data about the market far more than 10 or 20 years ago, but the numbers of winner traders have not increased at all. We are still at 90% losing rate between the investors and seems this is a constant number and only 10% of the investors are profitable.

After the last decades of computerisation we haven’t found yet the perfect 100% efficient system. That is the biggest failure of technical traders. We are still only guessing and we don’t see what holds the future. So what has changed in terms of trading with superfast computers? Nothing. We have to act in the market like 40 or 50 years ago. The rules are still the same like the following: 

  • Buy cheap stocks. 
  • Cut the loss and let the win ride. 
  • Buy a basket of bargain stocks. 
  • Rebalance your portfolio once a year, selling what's expensive and buying what's cheap. 
  • Doing this over time works. You can beat the market. 
  • A great company is not always a great stock, and a great stock is not always a great company. 

Why are we not doing these simple things instead of listening to our lagging indicators and try to find the magical forecaster indicator?

The BFM Assets Team.

Friday 11 April 2014

THE SENTIMENT IS MORE BEARISH

After many-many weeks finally the investors turned into bearish mood, which is a good buying signal. Why? Cause if everybody is bullish who is left to buy. The best sentiment survey is the weekly AAII Investor Sentiment Survey which measures the percentage of individual investors who are bullish, bearish, and neutral on the stock market for the next six months. http://www.aaii.com/SentimentSurvey?a=nmupdate041014side

Now they are more sceptical about the bullish upside and they turned part of them bearish. The bullish level came down from 55% (2013 December) under 30% by now, which is a significant drop and when is under 30% was always a really bargain price to buy the S&P500.


This year first time happens that drops the bullish sentiment, so we do hope finally the market will make a nice rally in short term. Since this sentiment indicator in short term is a very effective contrarian indicator, so we have to do the opposite what the mass does.


In most cases when the investors are concerned and step aside or sell the market the market does the opposite and heading north. Let’s see the next week, but we are expecting after the very volatile days some direct moves up. The market and investors are pretty nervous and show the one day red one day green pattern. One day goes up the market and the following day deletes the gain. That is the folklore now, like on this DJIA chart.


DO YOU WANT TO EARN OVER 30% PER YEAR?

Invest into our fully regulated Swiss Managed Account Fund: http://www.theblindfoldedmonkey.com/managed-accounts

The BFM Assets Team.

Thursday 10 April 2014

DOGS OF THE FTSE

As we posted yesterday we see more possibility and more potential profit in European indices. As we shared we are overpositioned in FTSE index plus we are strong buyer of some English stocks too. But there is an eternal question which stock we have to buy if our hypothesis is that the FTSE is bullish itself. As we are aware that we are horrible stock picker and market timer we love the system of Dogs of the Dow and Dogs of the FTSE. This methodology developed first for Dow Jones but you can use easily for any other markets.


The idea of the Dogs of the FTSE is that a portfolio of the 5 or 10 worst performing FTSE stocks last year(2013) historically beaten the index in the first three months of the following year (Q1 2014). The selection with this system is so easy and not subjective at all, it helps us being as objective as much as possible in the market and close out all the mental weaknesses.

So we picked up some stocks like Barclays, HSBC and some other blue chips because the rule says we have to ignore the middle,- or small cap company stocks. So far, the FTSE is around 1% on YTD, but we are over 9% so far. It is statistically proven that in the last more than 40 years you can beat the FTSE or DOW with this underdog system.

Sounds too simple and crazy? Yes, right. But, in most of the cases the simplest systems make the best performances. Complexity breaths confusion.

HSBC chart shows its relative weakness in 2013:


The BFM Assets Team.

Wednesday 9 April 2014

SOME GREAT BARGAIN INDICES

Namely we are over positioned in the followings and under positioned in US indices.

  • Aus200 from Sidney
  • IBEX from Spain
  • MIB from Italy
  • FTSE from UK
  • CAC40 from France
  • Bovespa from Brasil

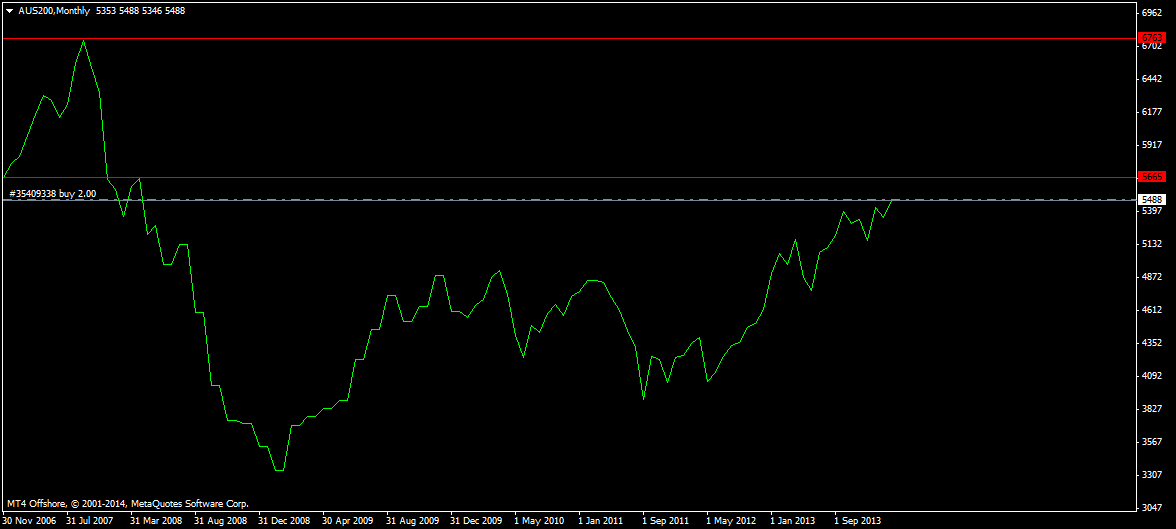
Why? Because in the last couple of days when all US indices were on the ground and the selling momentum was extreme, vast majority of investors turned into risk-off mood. Most of those indices above haven’t been reacted on the big sell off at all or just very slightly. They are really good bargain because all of them especially the AUS200 showed real strength yesterday and today when the Nasdaq dropped more than 4,5%.


In the last falling and correction days the AUS200 just dropped few points and tonight and today gained back again very closely to its previous top. The bullish momentum is pretty strong on AUS200 and also shows a great arbitrage deal because last year underperformed the US indices massively. And, it is still lagging behind. Now the price is around 5,500 and in our expectation could be easily within few weeks at the key resistance level at 5,665 and then the way is opened for upper rally up to 6,760 which was the previous top right before the world financial crisis in 2007.


The BFM Assets Team.

Tuesday 8 April 2014

SECOND DAY SELL OFF

Heavy selling again on Monday. Continued the correction after Friday in all US indices. Again the Nasdaq was leading in the weakness with -1.16%. In the last three days the index lost 4.6%, this is the biggest three day loss since 2011, which shows the broad selling momentum in the offensive sector.


  • Dow 16,246 -167 -1.02% 
  • Nasdaq 4,080 -48 -1.16% 
  • S&P 5001,845 -20 -1.08%

In the big picture the financial sector is hugely underperforming, last year this sector was the leader in the rally and in 2014 this sector is the worst performer so far. The volatility is still high; just remember on Friday yo-yo moves. Our expectation that the choppy market is going to continue further because tonight starts the earnings season after the closing bell which will create more stress and fear to the investors. Today the season starts with Alcoa.

The European indices do not show yet real weaknesses and holding well their levels, especially the IBEX and MIB, the Italian index.

The BFM Assets Team.
Monday 7 April 2014

BUTCHERY IN TECH SECTOR

On Friday was a brutal heavy selling in tech stocks – mostly biotechs and internet companies. The bad news is that the defensive sectors and indices were diving after the Friday afternoon macro news. In US 192,000 jobs created in March and the unemployment rate remained unchanged at 6.7%.


First the SP500 was lifted to intraday high and hit the 1,899 level.


Finally the Nasdaq made the worst day in two months – 2,59%. That is the second losing week in a row. The investors are more and more concerned about last year stars like Tesla -5.85% and Facebook.

  • Dow 16,413 -160 -0.96% 
  • Nasdaq 4,128 -110 -2.59% 
  • S&P 500 1,865 -24 -1.26% 

In SP500 only the defensive utility sector could close higher. In Europe the indices rose modestly in European session during the day, but later the selling was started and continued this morning further.

The BFM Assets Team.

Friday 4 April 2014

HOW TO PICK UP STOCKS?

There are two schools in the investment business. One prefers to own indices like John Bogle’s Vanguard Group and as gossip says now Buffett recommends to put all Berkshire Hathaway’s assets into a cheap index fund after his death. That is pretty common that the index fund investors are not „on hand” traders, but mostly „off hand” traders, which means they are in the vast majority of time they are passive traders and do not manage actively their portfolio.


The other school is the stock pickers. They have overwhelmingly „on hand” strategy and reshuffle daily or weekly basis their portfolio time by time. They are actively managing their portfolio and addicted by the market and check each out their positions. They love the gambling part of trading. They have smartphone and go to bed with stock market data and get up with them in the morning. That is obvious they are burning their energy, having huge stress, but the point is that most of the cases they are underperforming the index follower guys. They are the stock pickers. They fully believe they are able to beat the market and always seeking the alpha. But they lose always. Why? Because the market is inefficient and it is not possible to forecast which stock will perform well and which will not. We are as human beings are horrible stock pickers and market timers. It is not only a small investors specification, it is true about the big guys, the big funds as well. An average equity fund investor lagged behind the S&P500 by 3.96% on an annualized basis. Retail investors are really underperforming. In a 60/40 stock-and-bond split had a weighted average return of 7.46% over the 20 years ending in 2012, according to Dalbar's numbers. The typical retail investor experienced a weighted return of just 2.94%.

How can we beat the average? It is much easier than you think. Don’t buy the mainstream’s favourite, popular and well performing stocks, buy the boring ones and close your ears when the media wants to sell you any fancy stock. Being a good stock picker this is the only way, if you buy the undervalued and underperforming stocks. Own that which company’s valuation seems temporarily depressed. Whose track record is the most miserable.

DO YOU WANT TO EARN OVER 30% PER YEAR?

Invest into our fully regulated Swiss Managed Account Fund: http://www.theblindfoldedmonkey.com/managed-accounts

The BFM Assets Team.

Thursday 3 April 2014

WHY MARKETS CRASH?

That is the one million dollar question. Occur some other good questions not only why, but when and how. We never can be sure about when really comes the crisis, but it is always with us, it is only the question of the time when occurs and which market will crumble. The crashes are part of this business, it is like breathing without any air out we wouldn’t be able to get in any fresh air and we are gonna die. The markets will have always crashes, without exception. Rather than wondering if we're going to have another crash, spend our time planning how we will react to a crash when it inevitably comes. Mentally prepare ourself, have some cash. Just wait and be sure the new crash will happen.


Statistically proven that by 8% goes up the markets year by year. Why 8%? I don’t have any idea, my only guess that it is not extremely high and low and significantly over the inflation. What happens if the grows is stronger than 8%? Shortly, meaning within few years the market needs to make correction to reduce the median back again to 8%. And if the return is less than 8%, the market will do faster growths than 8% and catch up the 8% level again. The market doesn’t respect the extremes. Therefore, we always have to trade the extremes because there is a significant tendency of the market heading to the normality.

The other key factor is by Morgan Housel „Markets crash all the time. You should, at minimum, expect stocks to fall at least 10% once a year, 20% once every few years, 30% or more once or twice a decade, and 50% or more once or twice during your lifetime.” Those who don’t understand this will eventually learn it the hard way”. That is a fascinating point. Most of the traders don’t understand that and try to always buy the tops. They just look back into the rear mirror and see the nice performance back in the last months. But, I am fully convinced the profitable trader also takes a look back at rear mirror but he is looking for not the tops but the dips and buy the crashes. It is a contrarian attitude and sometimes is so hard to follow that approach. We have to have patience and waiting for the good opportunities and buy the bargains, maybe it comes once a year, but will be a fruitful deal for sure.

When the crash comes don’t panic and hesitate for a second. Don’t look at the crash as a horrible and miserable momentum, look at the crash as a new and buying opportunity and buy more and more stocks. The volatility is a good friend of the great traders. Volatility scares enough people out of the market to generate superior returns for those who stay in," Jeremy Siegel said a few years ago.

The BFM Assets Team.

Wednesday 2 April 2014

BEARS IN THE CAVE

Bulls are in the market. Mr. Market made a nice rally in the last couple of days. S&P500 is on new historical high, Spanish IBEX and Italian index are on multi year high. The momentum is so strong on the long side.


Yesterday US markets ended sharply higher, the lagging Nasdaq made a great rally +1,64%, and again on positive side YTD. What a green day.

  • Dow 16,533 +75 +0.46% 
  • Nasdaq 4,268 +69 + 1.64% 
  • S&P 500 1,886 +14 +0.73% 

The intraday high was 1,889 for S&P500 which means we are so close to hit the 1,900 mental level. The first day of Q2 2014 get started really well. The index took out yesterday the key resistance level at 1,880 so the way is opened up to north.


The internal structure of the market is not the perfect because the technology sectors are performing poorly and the defensive ones are doing well. But never mind, the point is the market is on new high, so we don’t need to cry.

All European indices are broadly higher, take a look at ITA40 from Milano, how strong the bullish sentiment. We are buying the Italian market since 2013 December and we are expecting more upside move this year because it is massively undervalued and the new young government started the war against the corruption and bureaucracy so it is great fundamental underlying parameter for the bulls in Italy.


The BFM Assets Team.

Tuesday 1 April 2014

JOHN BOGLE - THE "3 WORDS RULE" OF THE MARKETS

John C. Bogle - Siant Jack is the industry nickname - is a founder and retired CEO of the Vanguard Group. One of the most successful contemporary investor. He emphasizes only investor, he is not a speculator, as he says investing is long term wealth creation on the contrary the speculation that is a loser’s game.


And what is his "3 WORDS RULE”?

When he was at Princeton he had started to work for a brokerage firm. There was one of the old runner said to him:

- "I am gonna tell you everything what you need to know if you are going into the investment business.
- What’s that?
- And he said, three words. NOBODY KNOWS NOTHING.”

All of us meet each day a trader or guru who thinks that he is smart enough giving advices. And he does that with 100% confidence. The gold by next week go up to 1600, the oil goes down within one week to 70 bucks. They should have some kind of crystall ball. But believe me, nobody has any holy grail. In simple way we are not able - none of us - predict the future. If anybody tells you EURUSD will move to 1,3400 for sure. At least what you have to do is being sceptical, but the the best way ignore fully and closed out those sort of advices.

We do not know what the future holds, we only guess. We look at the past which sometimes misleads us, sometimes doesn’t. That is part of our job. Therefore, there is no 100% hit-rate systems, we have to lose money many times. This is our payment to the devil of market. The market is very hard to deal with. We all have opinions out there, and we say to our self I am smarter than anybody else and that just not gonna happen. It is impossible. We are not smart enough. If anybody is overconfident and really believes he is smarter than anybody, I can guarantee he will lose all his capital.

John Bogle’s system is a passive approach of the market. This is perfect buy&hold strategy. As he says „BUY RIGHT AND HOLD TIGHT”. His system is simple, but overwhelmingly profitable. In 1975 he founded the Vanguard Mutual Fund and after one year in 1976 he introduced the first index fund for individual investors, which is called the Vanguard 500. Here is the historical performance since 1987.

http://finance.yahoo.com/echarts?s=VFINX+Interactive#symbol=vfinx;range=my;compare=;indicator=volume;charttype=area;crosshair=on;ohlcvalues=0;logscale=off;source=undefined

Since 1987 the YTD performance is around 20% in each year, and total performance is over 416%. Now the fund has in assets more than 2 trillion dollar.

The BFM Assets Team.